
Understand your patterns
Patterns you can't see day to day.
Insights look across 7, 30 or 90 days: how often episodes happen, how high they go, how fast you recover, and what seems to go with your heavier days.

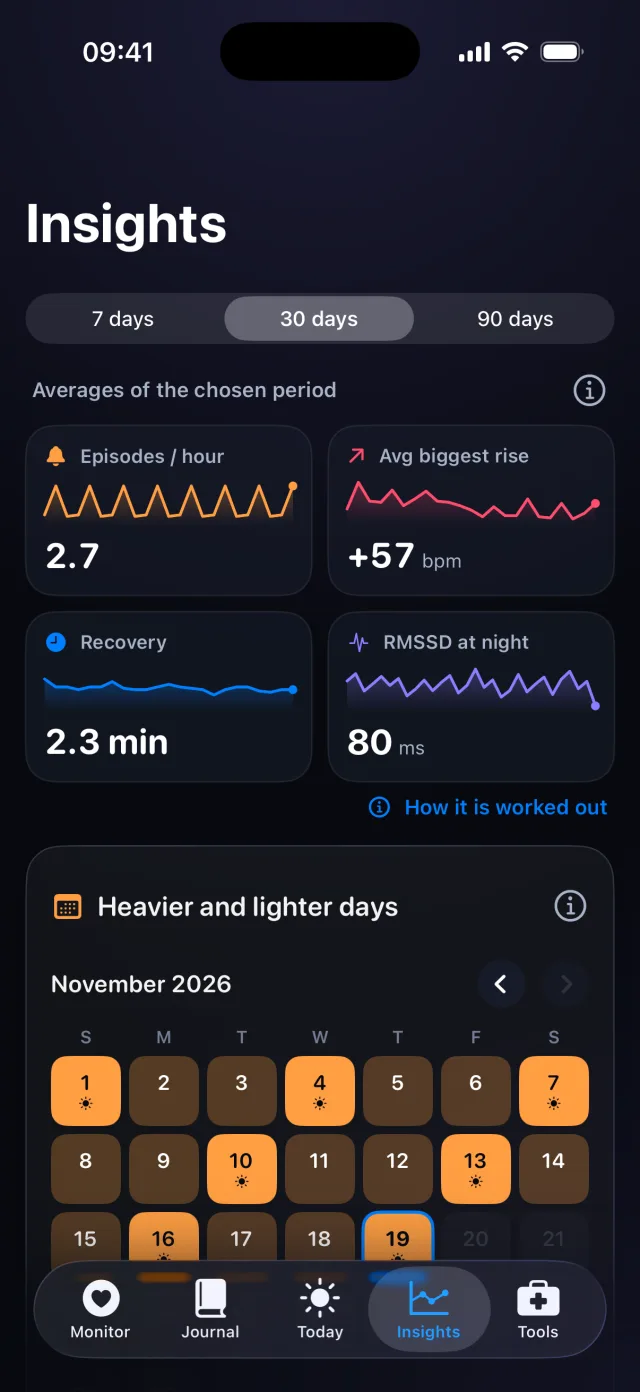
How it works, step by step
Real screens from the POTS iPhone app, with fictional example data.
-
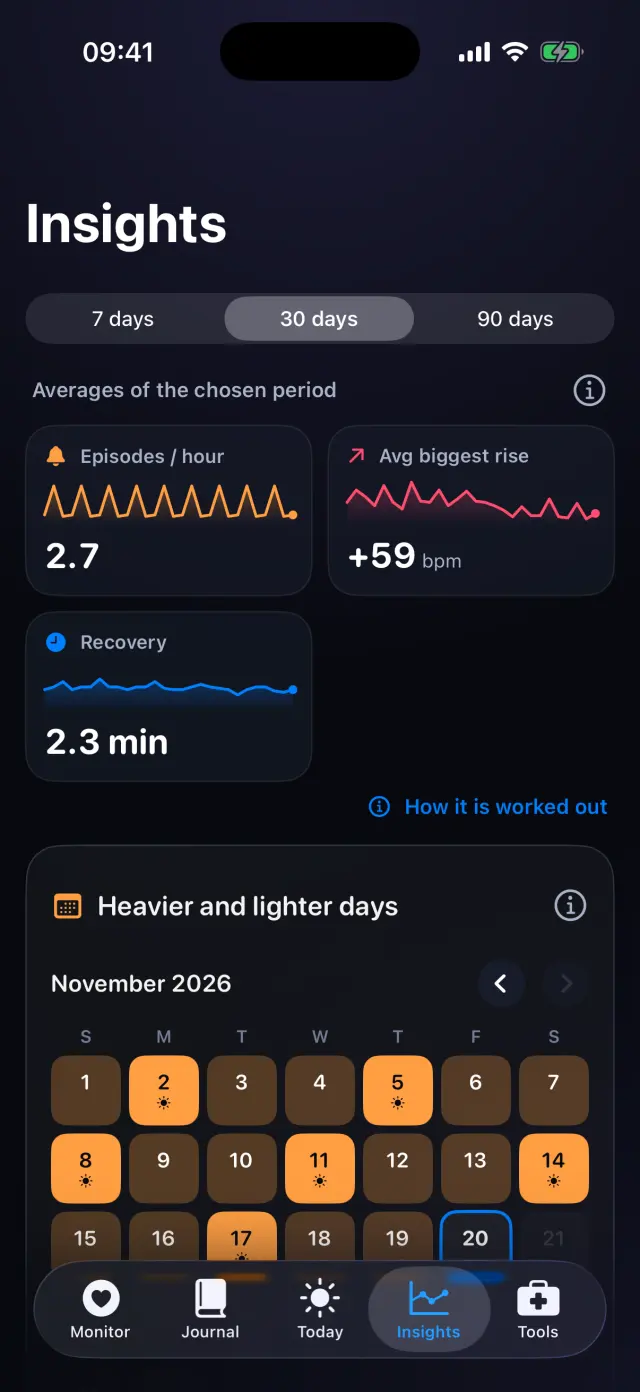
Choose a period
Averages for 7, 30 or 90 days, with a small chart for each.
-
Heavier and lighter days
A calendar colors each day from lighter to heavier, so you can spot patterns at a glance.
-
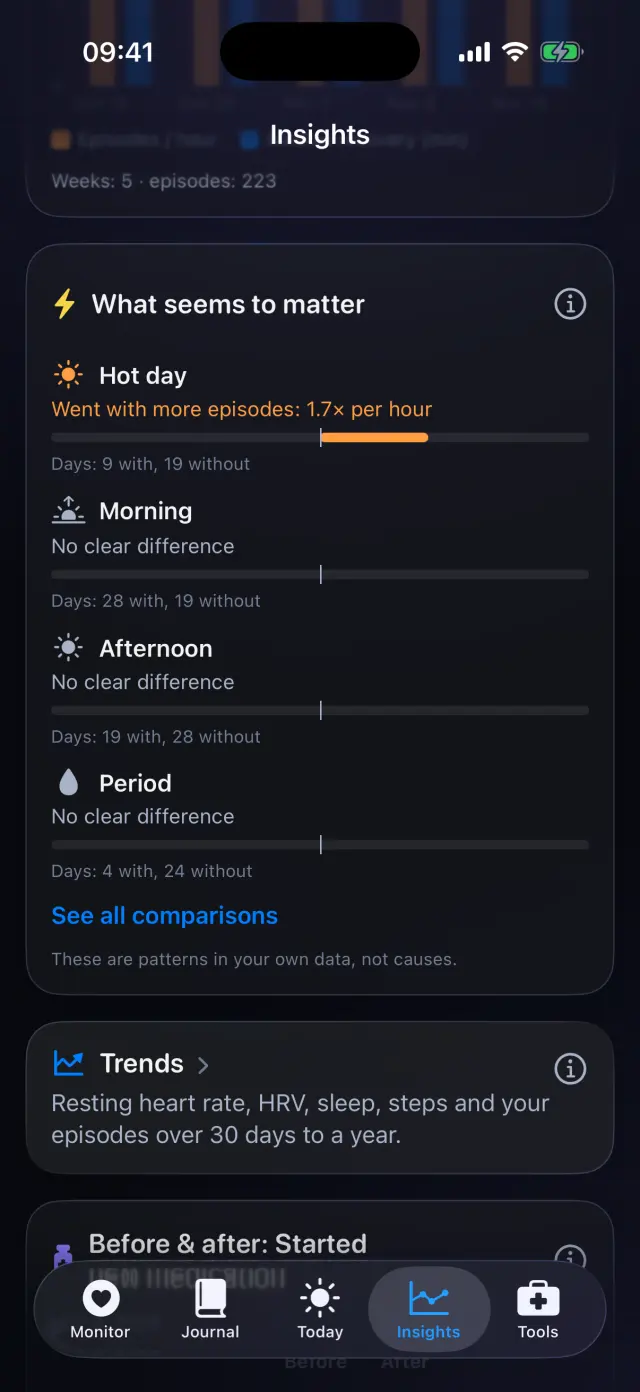
What seems to matter
POTS compares days with and without things like a hot day, your period or a missed dose. These are patterns, not causes.
-
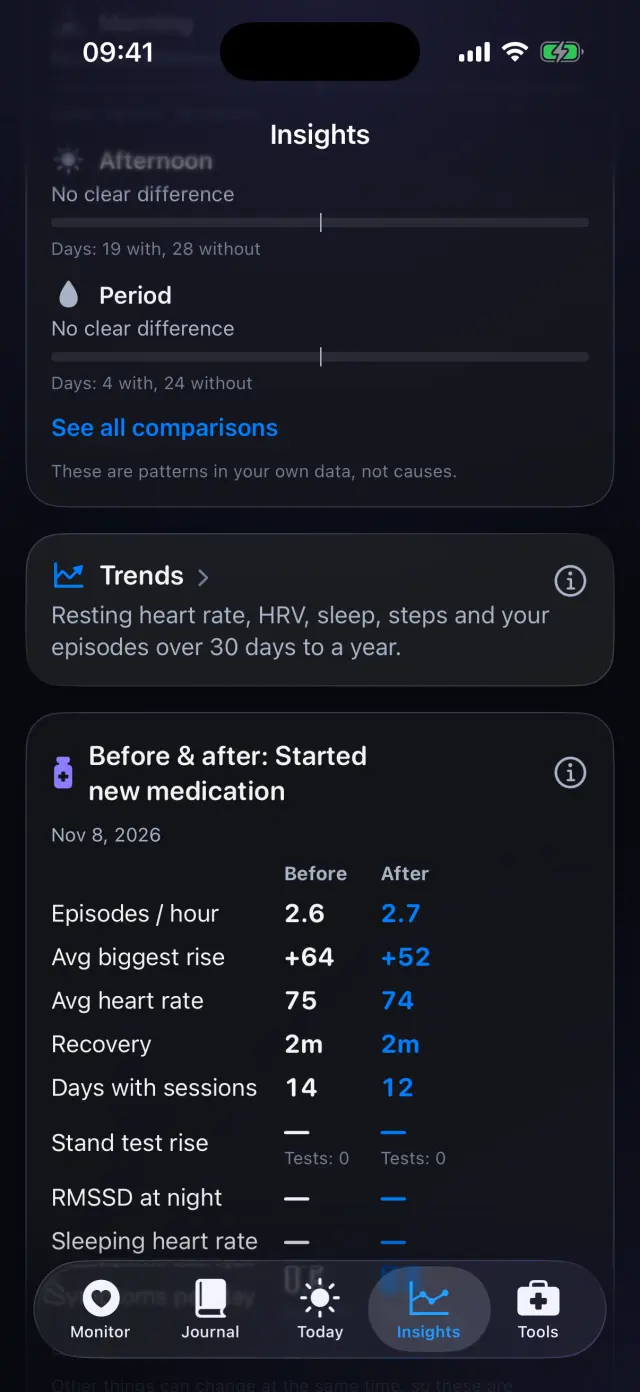
Before and after a change
Compare the 14 days either side of a medication or treatment change.
-
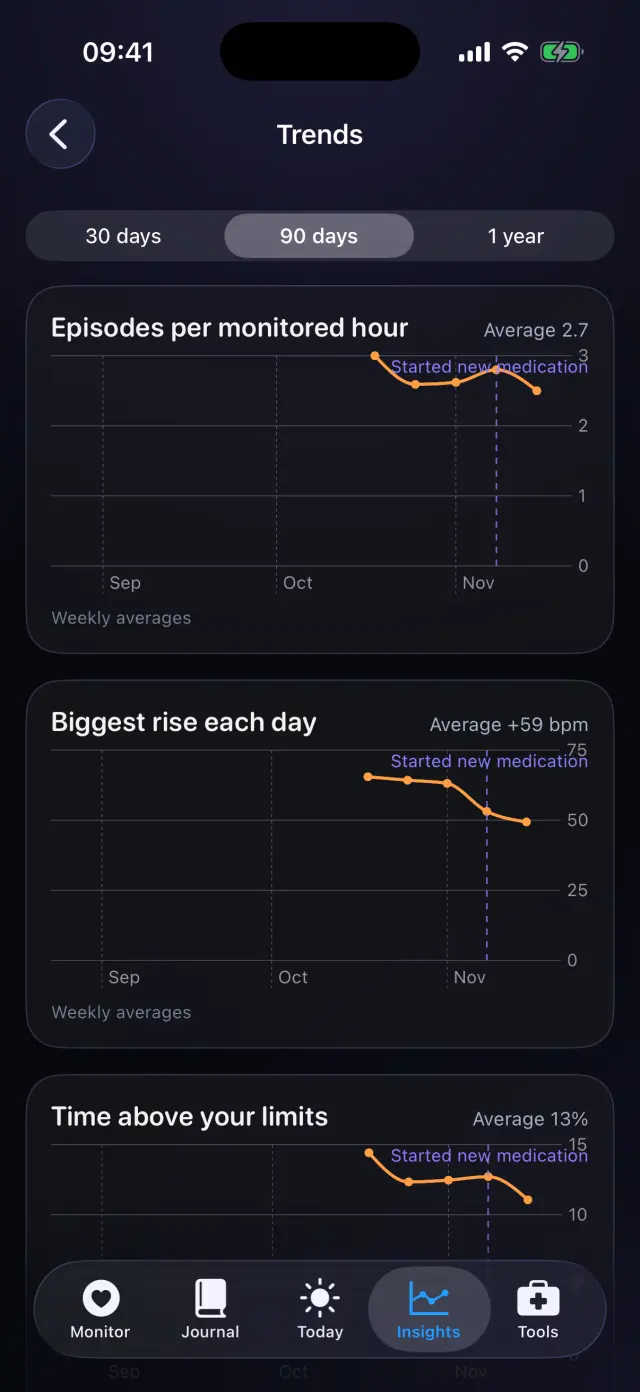
Trends up to a year
Episodes, biggest rise, time above your limits, resting heart rate, HRV, sleep and steps, with changes marked.
Swipe to see every step
Everything it can do
- Averages for 7, 30 or 90 days.
- A heavier-and-lighter-days calendar.
- What seems to matter: heat, sleep, fluids, salt, doses, workouts and time of day.
- Before-and-after comparisons for medication and treatment changes.
- Trends from 30 days to a year, plus your stand-test rise.
- A plain explanation of how every number is worked out.
Goes well with
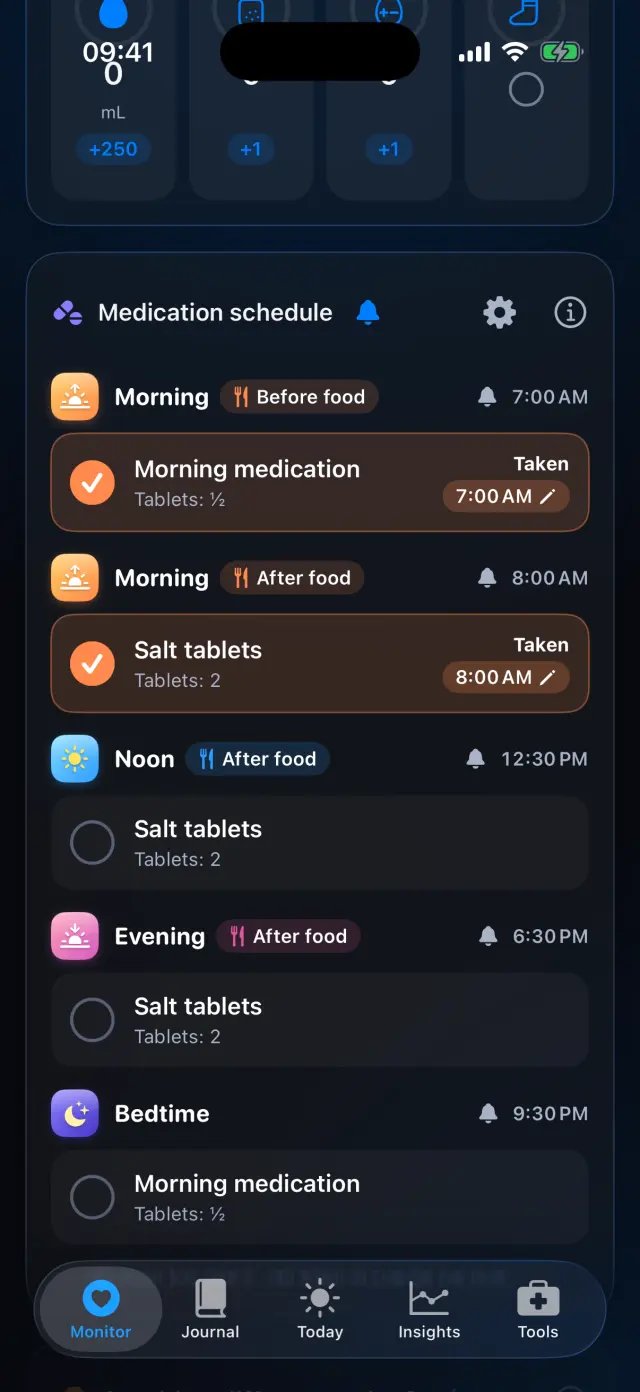 Medications and remindersBuild a schedule, get reminders, tick off each dose and see what changed.See how it works
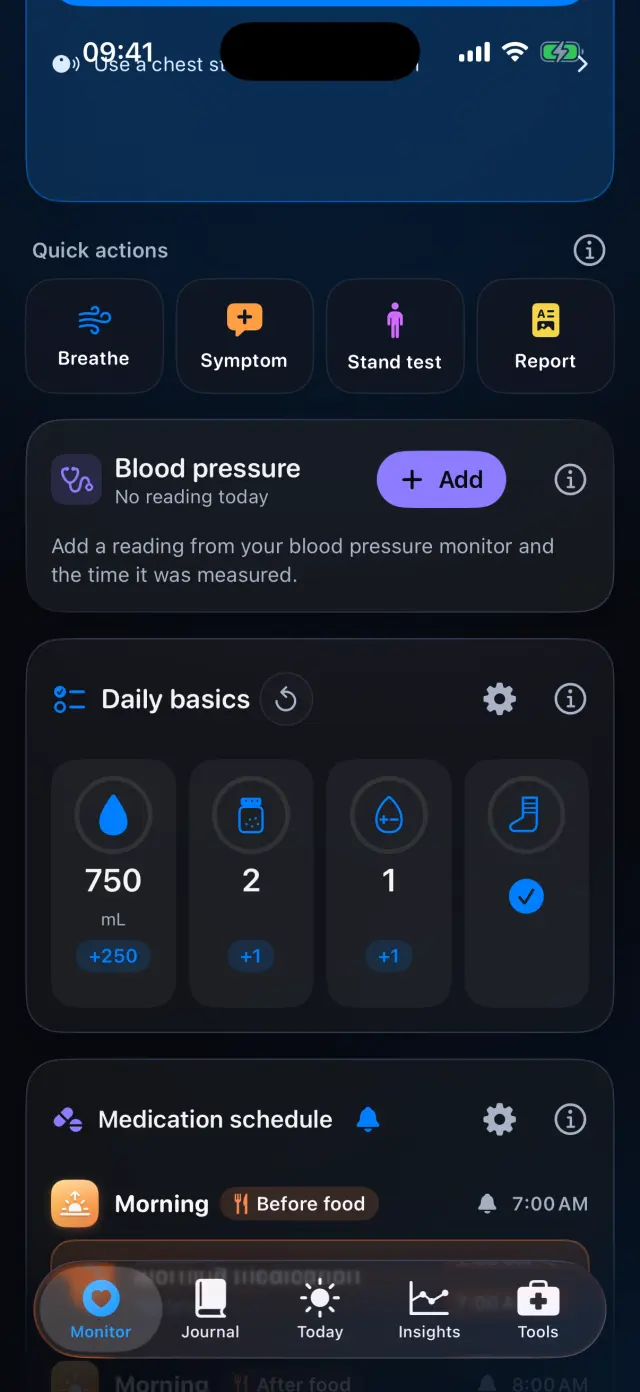 Daily basicsFluids, salt, compression and your own trackers, plus what was different today.See how it works
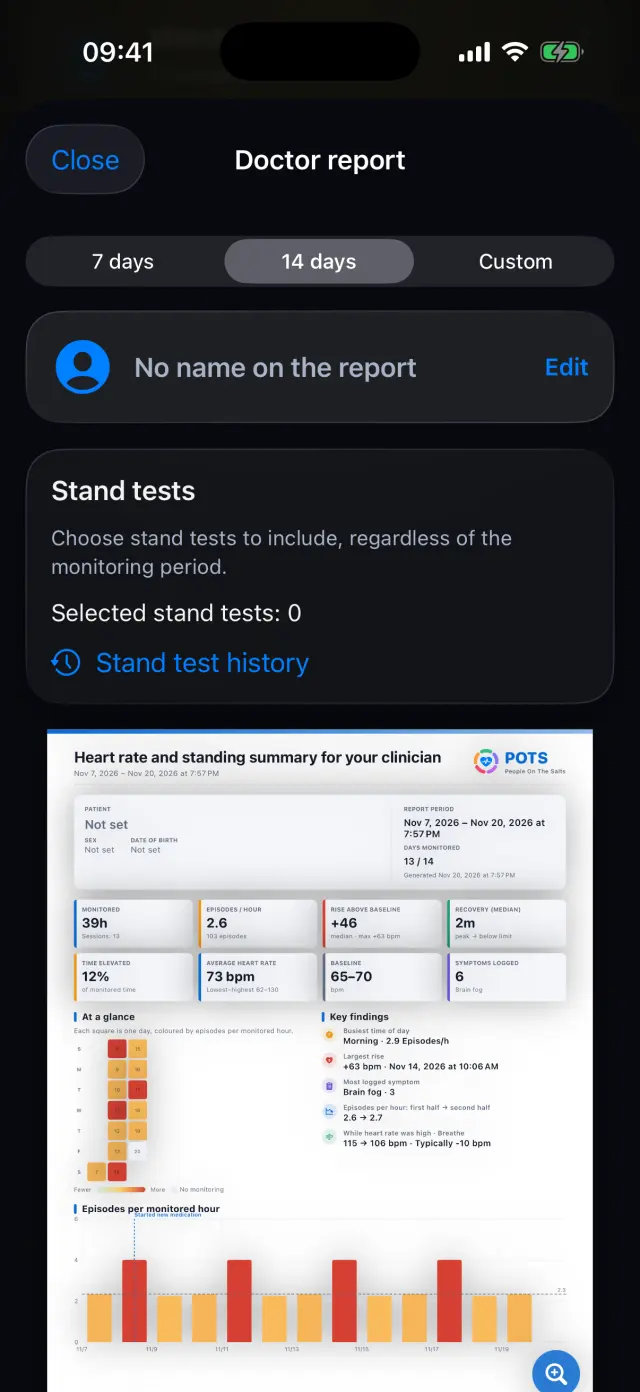 Doctor report and exportA clear PDF for your clinician, and your data as files.See how it works

Try it on your iPhone.
POTS - People On The Salts for iPhone and Apple Watch. Free to download, with Premium when you want the full record.
Screens show fictional data. POTS shows measurements to discuss with your clinician. It does not diagnose or treat any condition.